Market overview & Insight
Mongolia’s economy, its growth drivers and the opportunity for private capital — presented with data.
Why Mongolia
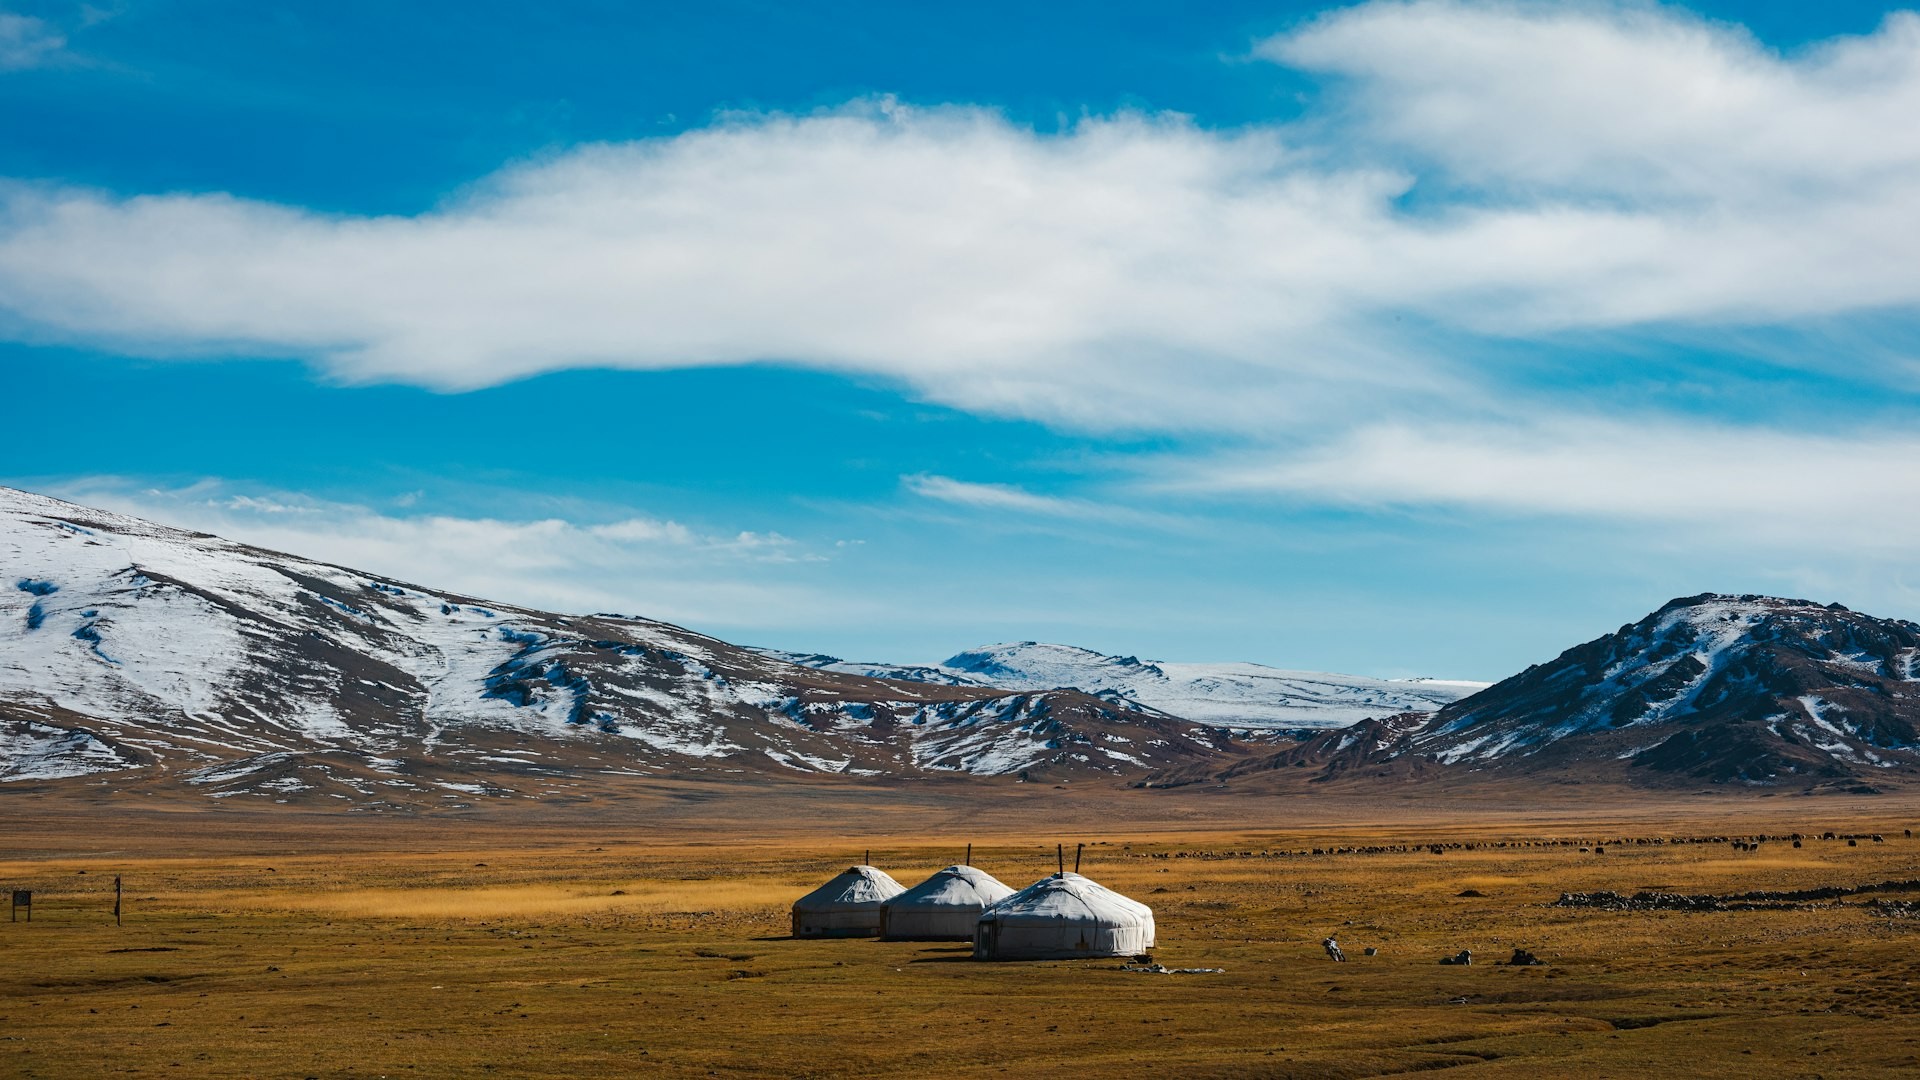
Bordered by Russia and China, Mongolia holds vast untapped mineral wealth — among the world’s leading copper, gold and coal reserves — alongside a fast-growing services, digital and renewable-energy economy. A young population and a deepening capital market create growing demand for long-term private capital.
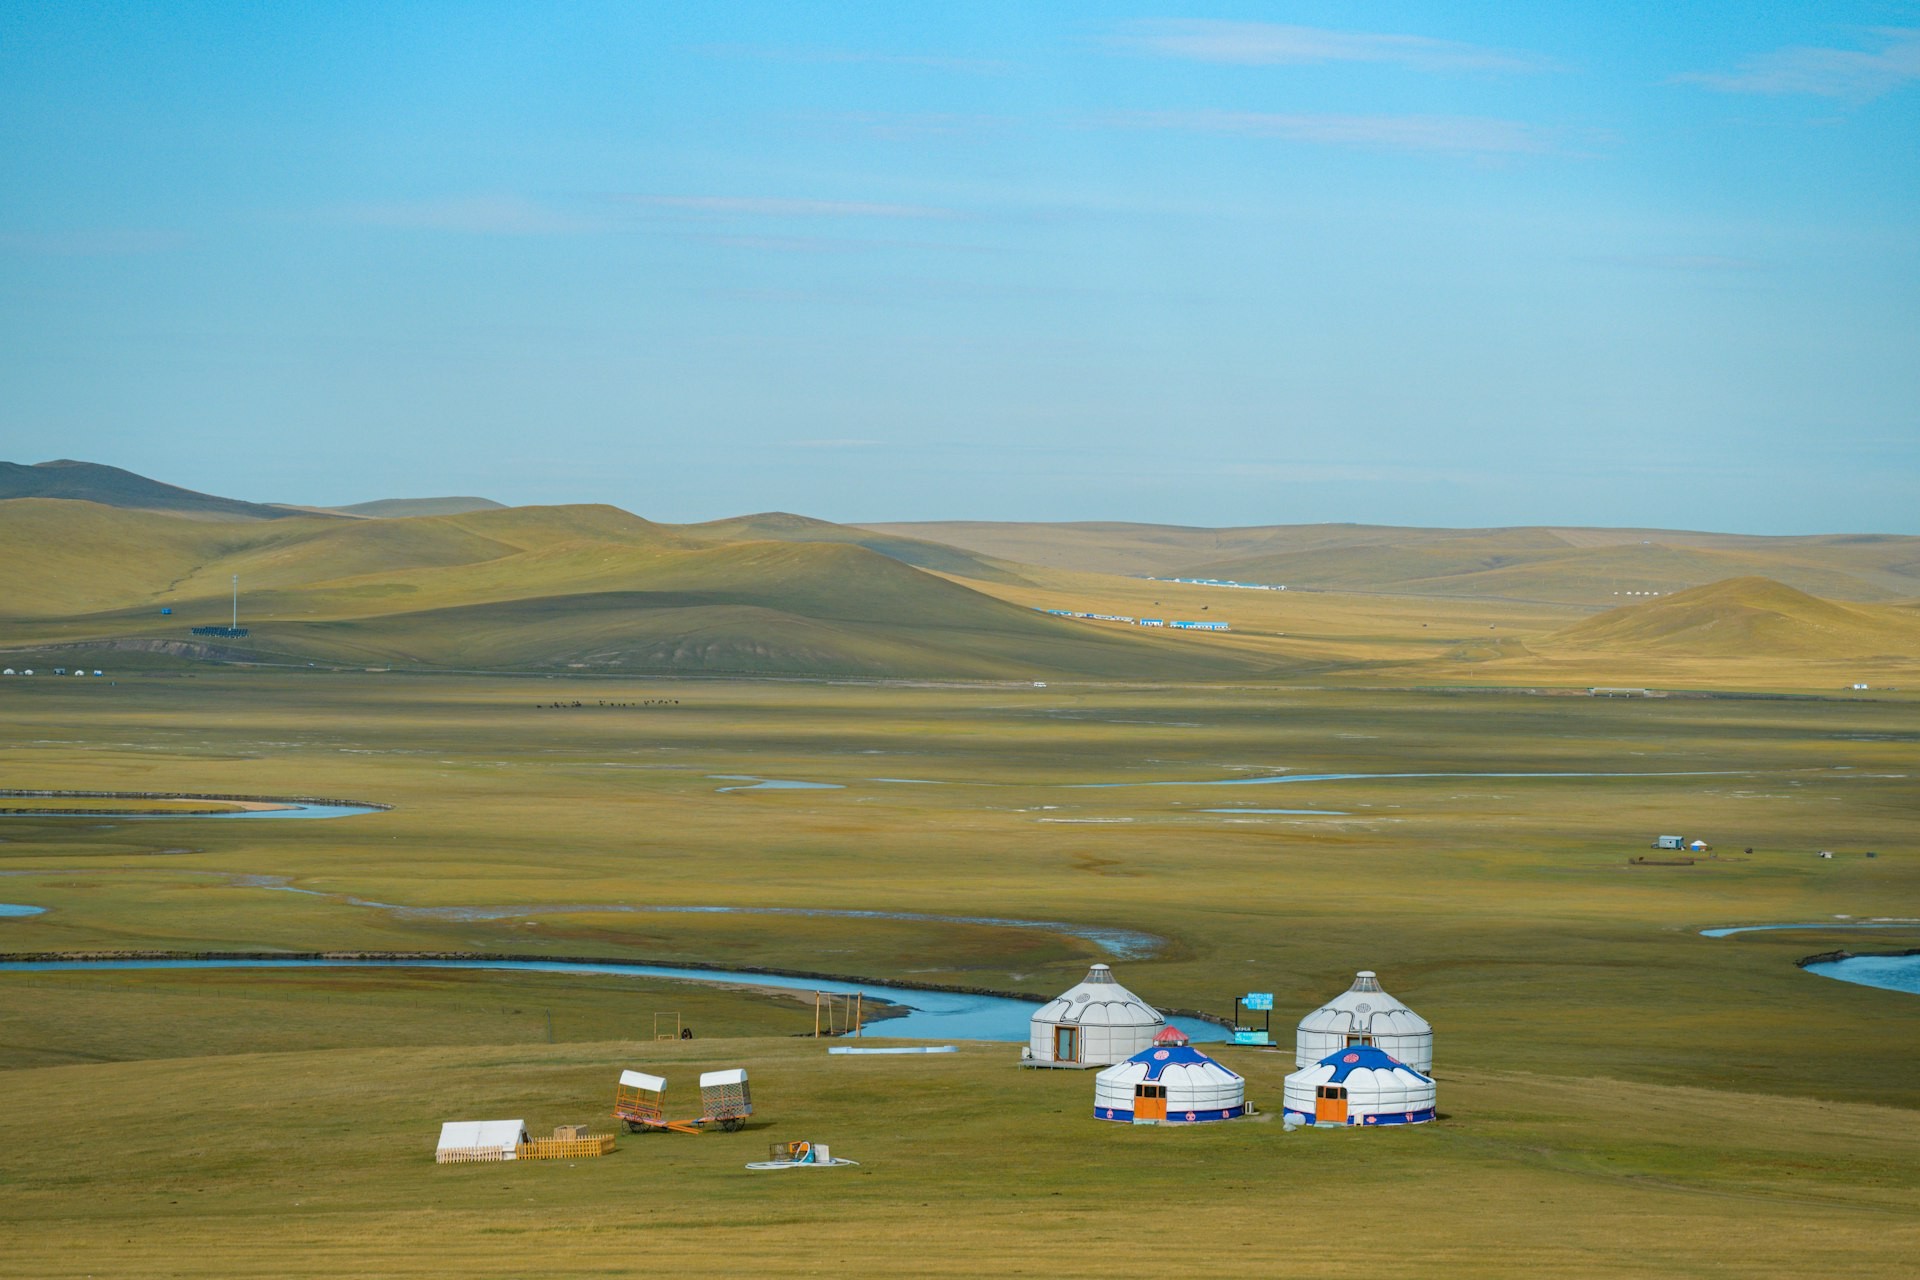
Young and dynamic demographics
A productive, young population. Source: National Statistics Office of Mongolia.
Key growth drivers
Structural strengths behind Mongolia’s long-term investment case.
World-class natural resources
Among the world’s top 10 resource reserves, estimated at around USD 2 trillion.Renewable energy potential
Abundant solar and wind resources with potential to become a regional energy leader.Agricultural resources
A strategic supplier of livestock, cashmere and food products to China and beyond.Growth track record
The world’s fastest-growing economy in 2011, with 17.3% real GDP growth.Mongolia’s economic growth
The economy is resilient, with projected annual GDP growth of 6–8% over the next five years, fuelled by large-scale mining, infrastructure development and ongoing diversification.
GDP, current USD
23.7B USD
2024
| Year | bn USD |
|---|---|
| 2011 | 10.41 |
| 2012 | 12.29 |
| 2013 | 12.6 |
| 2014 | 12.2 |
| 2015 | 11.6 |
| 2016 | 11.2 |
| 2017 | 11.5 |
| 2018 | 13.2 |
| 2019 | 14.2 |
| 2020 | 13.3 |
| 2021 | 15.1 |
| 2022 | 17.1 |
| 2023 | 19.8 |
| 2024 | 23.67 |
GDP growth, real
6.14%
2024
| Year | % |
|---|---|
| 2011 | 17.3 |
| 2012 | 12.3 |
| 2013 | 11.6 |
| 2014 | 7.9 |
| 2015 | 2.4 |
| 2016 | 1.5 |
| 2017 | 5.6 |
| 2018 | 7.7 |
| 2019 | 5.6 |
| 2020 | -4.6 |
| 2021 | 1.6 |
| 2022 | 5 |
| 2023 | 7 |
| 2024 | 5 |
GDP per capita, USD
6,700 USD
2024
| Year | USD |
|---|---|
| 2011 | 3736 |
| 2012 | 4328.9 |
| 2013 | 4366 |
| 2014 | 4159 |
| 2015 | 3875 |
| 2016 | 3658 |
| 2017 | 3687 |
| 2018 | 4157 |
| 2019 | 4405 |
| 2020 | 4061 |
| 2021 | 4535 |
| 2022 | 4947 |
| 2023 | 5655 |
| 2024 | 6700 |
Inflation
9%
2024
| Year | % |
|---|---|
| 2011 | 8.4 |
| 2012 | 14.3 |
| 2013 | 10.5 |
| 2014 | 12.3 |
| 2015 | 5.7 |
| 2016 | 0.7 |
| 2017 | 4.3 |
| 2018 | 6.8 |
| 2019 | 7.3 |
| 2020 | 3.7 |
| 2021 | 13.8 |
| 2022 | 13.2 |
| 2023 | 7.9 |
| 2024 | 9 |
Source: World Bank, National Statistics Office of Mongolia (via Premium Nexus). Data as of 2024.
Capital Markets
Mongolia’s capital market is deepening — from government and corporate bonds to equity listings and bank IPOs.
Mongolia’s capital market
Key indicators of the Mongolian Stock Exchange and domestic bond market.
MSE market capitalization
X.X trn MNT
Sample data
| Year | trn MNT |
|---|---|
| 2019 | 2.5 |
| 2020 | 2.3 |
| 2021 | 3.4 |
| 2022 | 3.2 |
| 2023 | 4.1 |
| 2024 | 6 |
| 2025 | 7.2 |
Total value traded
XXX bn MNT
Sample data
| Year | bn MNT |
|---|---|
| 2019 | 90 |
| 2020 | 110 |
| 2021 | 240 |
| 2022 | 180 |
| 2023 | 260 |
| 2024 | 420 |
| 2025 | 510 |
Bonds outstanding
X.X trn MNT
Sample data
| Year | trn MNT |
|---|---|
| 2019 | 1.1 |
| 2020 | 1.3 |
| 2021 | 1.6 |
| 2022 | 1.9 |
| 2023 | 2.4 |
| 2024 | 3 |
| 2025 | 3.6 |
Number of listed companies
XXX
Sample data
| Year | companies |
|---|---|
| 2019 | 190 |
| 2020 | 186 |
| 2021 | 182 |
| 2022 | 180 |
| 2023 | 178 |
| 2024 | 176 |
| 2025 | 175 |
Source: Mongolian Stock Exchange, FRC (to be confirmed). Sample data shown for layout only.
OTC Market
Mongolia’s over-the-counter bond market — a growing source of MNT and USD fixed-income opportunities.
OTC bond market
Issuance, outstanding volume and yields of bonds registered on the OTC market.
OTC bond issuance
XXX bn MNT
Sample data
| Year | bn MNT |
|---|---|
| 2019 | 60 |
| 2020 | 45 |
| 2021 | 120 |
| 2022 | 210 |
| 2023 | 380 |
| 2024 | 520 |
| 2025 | 640 |
OTC bonds outstanding
X.X trn MNT
Sample data
| Year | trn MNT |
|---|---|
| 2019 | 0.2 |
| 2020 | 0.25 |
| 2021 | 0.33 |
| 2022 | 0.5 |
| 2023 | 0.8 |
| 2024 | 1.1 |
| 2025 | 1.4 |
Average coupon, MNT bonds
XX%
Sample data
| Year | % |
|---|---|
| 2019 | 17 |
| 2020 | 16 |
| 2021 | 15.5 |
| 2022 | 16 |
| 2023 | 17.5 |
| 2024 | 18 |
| 2025 | 17 |
Number of issuers
XX
Sample data
| Year | issuers |
|---|---|
| 2019 | 8 |
| 2020 | 9 |
| 2021 | 13 |
| 2022 | 19 |
| 2023 | 28 |
| 2024 | 37 |
| 2025 | 45 |
Source: FRC / MSE OTC registry (to be confirmed). Sample data shown for layout only.
Monthly insights
Research and commentary from our investment team.
Explore Opportunities
Discover our current fund — its objective, strategy and key terms. Qualified investors can request the fund factsheet and documents through a short form.